

AppsFlyer's latest report on mobile market trends reveals significant shifts in user acquisition (UA) and revenue distribution across mobile app sectors in 2024. The analysis draws from data covering over 35,000 apps, tracking 140 billion installations and 53 billion re-marketing conversions. The standout finding: gaming apps are lagging behind non-gaming counterparts in both user acquisition performance and revenue growth.

Generic Gaming Image

Use code TRYHARD33 at checkout to redeem this offer before code expires again.
Get 33% Off GAMES+ Subscription
Increase in User Acquisition Spending
Total user acquisition spending in 2024 climbed 5% to reach $65 billion, bouncing back from a 6% drop in 2023. The recovery isn't evenly distributed. Non-gaming apps drove an 8% increase in UA spending, while gaming apps fell 7% over the same period.
Within gaming, the money has shifted heavily toward casual games. Casual projects now represent 64% of total gaming UA spending, up from 61% previously. Mid-core games and social casinos took the hardest hits, with UA spending collapsing 21% and 12% year-on-year. These declines point to deeper structural problems in those segments.
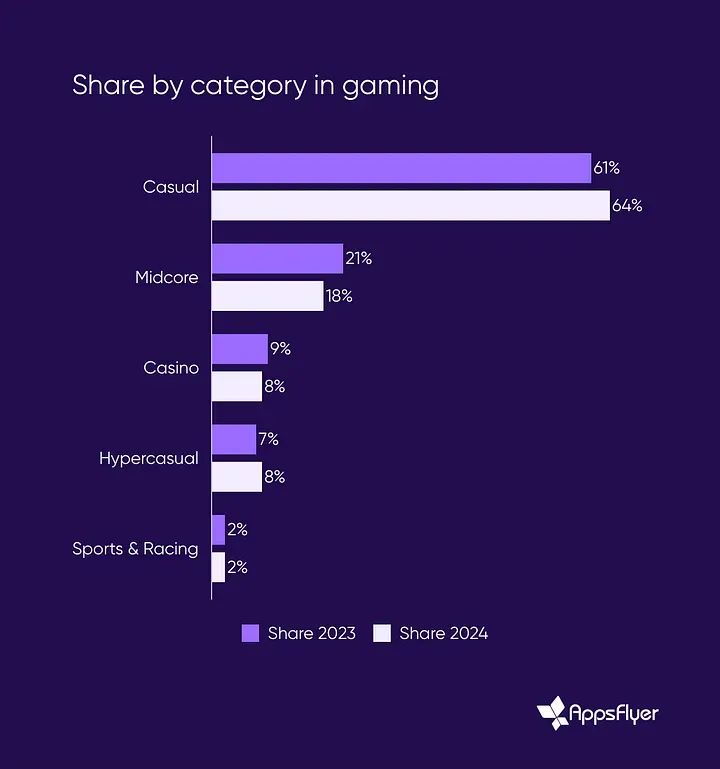
Share By Category in Gaming
Despite lower budgets, some genres managed to grow their user bases. Sports and racing games added 18% more paid users, casual games grew 14%, and even mid-core games picked up 6% more users while spending significantly less.
Falling Cost Per Install (CPI) rates explain part of this dynamic. Mid-core games, for instance, acquired more users while cutting ad spend, making their campaigns more efficient even as overall investment shrank.
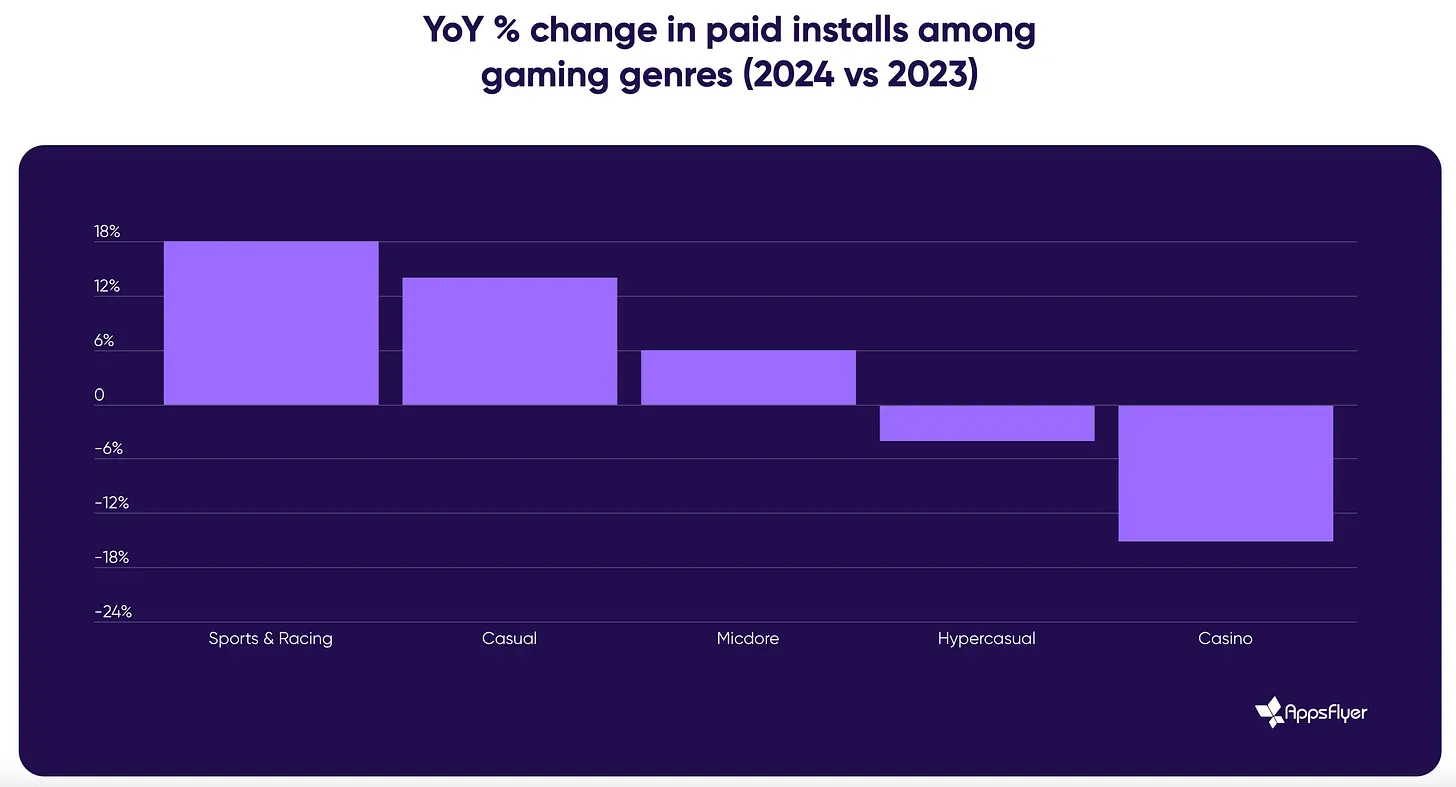
YoY Percentage Change in Paid Installs Among Gaming Genres
Revenue Growth in Non-Gaming Apps
The revenue gap between gaming and non-gaming apps widened dramatically in 2024. Non-gaming apps posted nearly 20% growth in in-app purchase (IAP) revenue. Gaming apps couldn't keep pace. Social casinos managed 4% year-on-year revenue growth, but casual and mid-core apps both declined—down 5% and 2%, respectively.
Advertising revenue grew across both sectors, though non-gaming apps again dominated with a 26% year-on-year increase. Gaming's ad revenue rose 7%, with mid-core games leading the category at 21% growth compared to 2023.
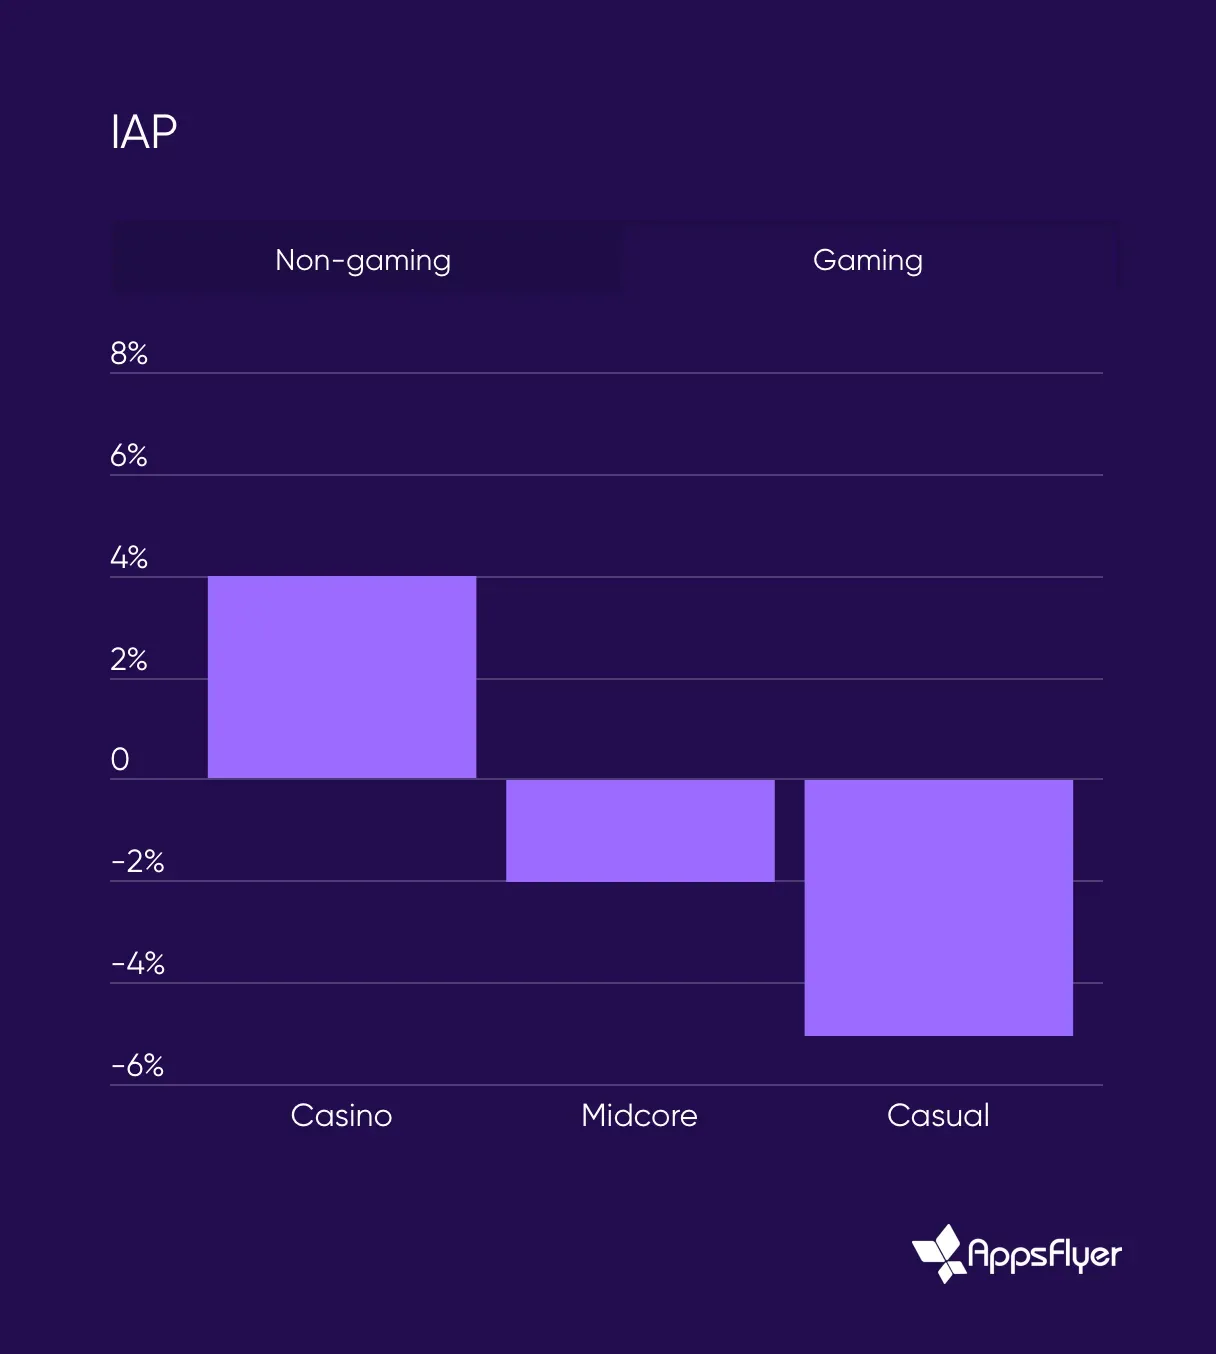
IAP: Non-gaming vs Gaming
App Downloads Across Platforms
Download numbers showed modest movement across genres. Mid-core games gained 5% more installs, casual games added 4%, and sports/racing apps grew 1%. Social casinos and hypercasual games moved in the opposite direction, dropping 5% and 10% in installs.
Platform differences matter. On Android, mid-core and casual games performed better, up 9% and 6% year-on-year. Hypercasual games also saw a 2% increase in Android downloads. iOS showed a different pattern, with social casinos surging 22% compared to the previous year.
Creative Production Trends in 2024
Creative output exploded in 2024. Top-performing apps—those generating over $1 million in monthly revenue—nearly doubled their creative production. Across the board, the number of creatives produced jumped 40%, reflecting how critical fresh ad content has become for user engagement.
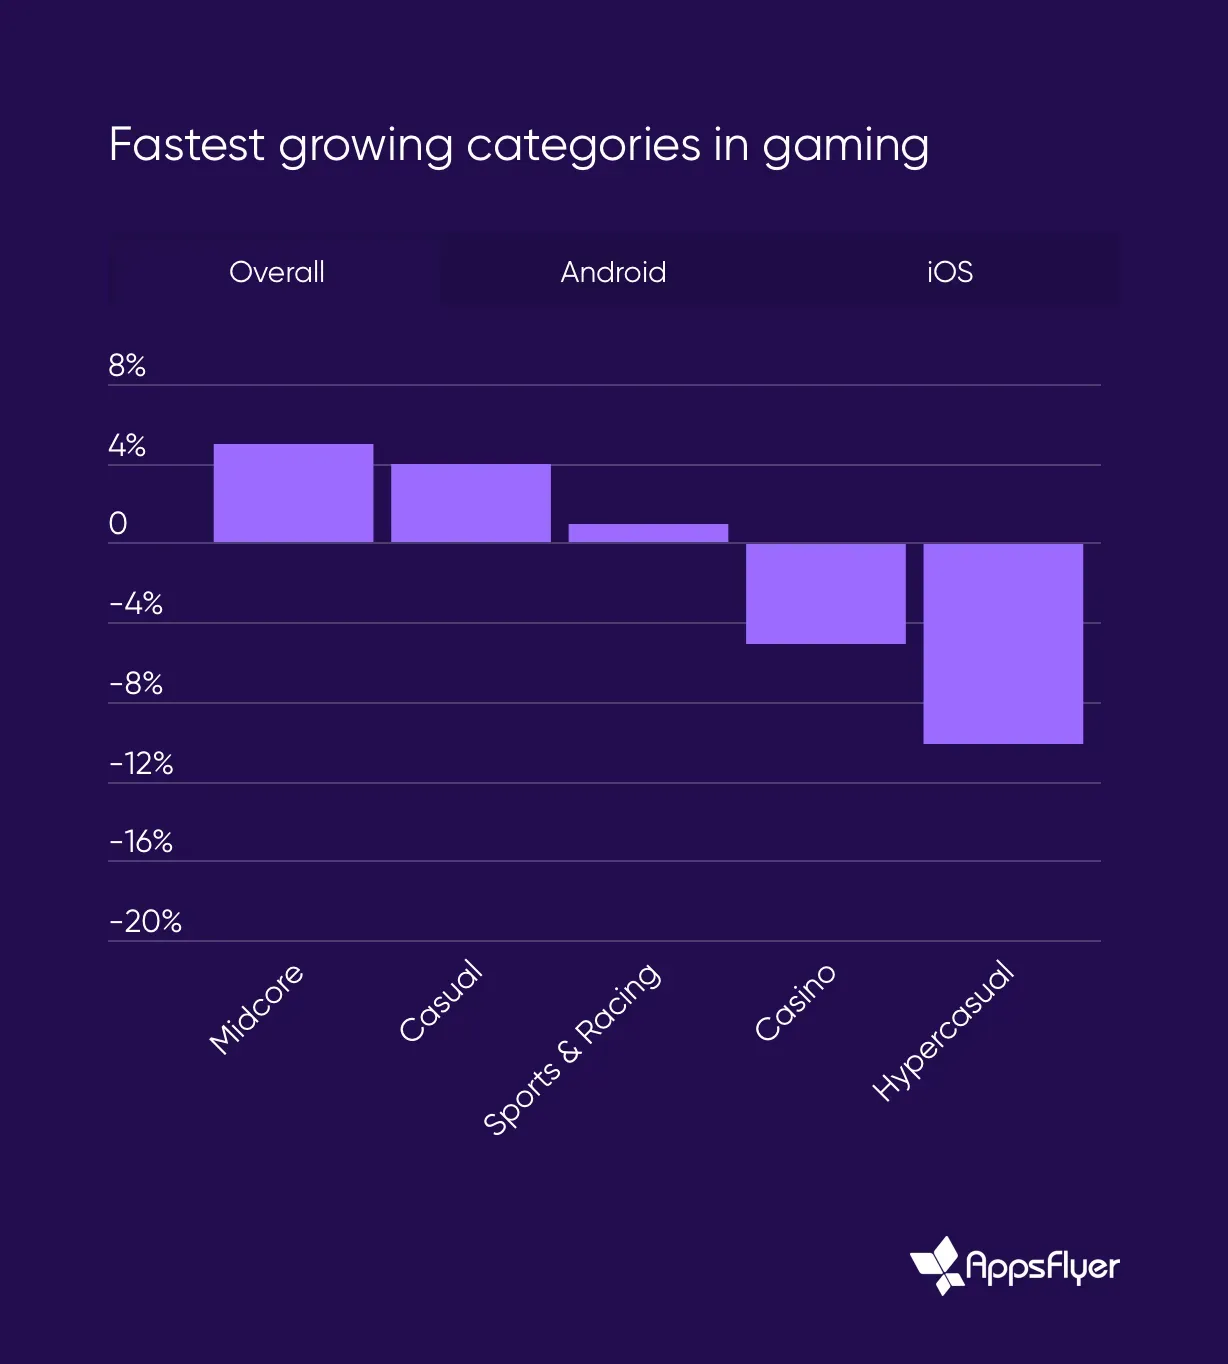
Fastest Growing Categories in Gaming
Relevance to Web3 Gaming
These 2024 mobile market trends carry direct implications for web3 gaming. The data shows how traditional gaming apps are losing ground to non-gaming apps in user acquisition and revenue generation, which should inform how web3 projects approach marketing and monetization.
The collapse in mid-core and social casino UA spending, combined with non-gaming apps' dominance in traditional advertising networks, suggests web3 gaming needs sharper, more cost-effective marketing strategies to compete for users. As web3 gaming integrates more decentralized elements, the revenue trends—particularly in advertising and in-app purchases—offer a roadmap for sustainable growth and user retention.


![Walking in GTA V - Los Santos International Airport [ 4K Ultra - Natural Vision Evolved ]](https://assets.games.gg/gta_5_flights_v_mod_airports_hero_1af1376cf2.webp)