
Planning mobile game marketing costs for 2027 starts with earlier benchmarks, not a universal price per player. Adjust reports a 2025 global blended cost per install (CPI) of $0.56, but costs range from $0.14 in Latin America to $4.47 for slots. US Apple Ads search had a median CPI of $4.63.
This guide covers mobile-specific CPI, ROAS, soft launches, creative, creators and ASO. For general benchmarks and budget-tier allocations, see our game marketing budget guide.
Why mobile game marketing costs are rising
More money is chasing fewer installs. Sensor Tower's H1 2026 data shows gaming downloads fell 12% to 24 billion, in-app purchase revenue slipped 2% to $40 billion, and gaming digital ad spend grew 8% to $7 billion. Puzzle took 33% of ad spend and strategy 21%. In-app ad networks carried 54.8% of mobile ad spend, while YouTube, at 16.4%, was the fastest-growing major channel (PocketGamer.biz, reporting Sensor Tower).
Adjust's 2026 Gaming App Insights, covering January 2024 to January 2026, shows average CPM rising 20% to $4.34 and CPC increasing from $0.03 to $0.04. Only 39% of iOS users opted into tracking in Q1 2026, reducing targeting and measurement precision (GameDev Reports summary of Adjust).

What counts as a good mobile game CPI?
A good CPI is below what a player is worth to you. Use these benchmarks for direction, keeping their different reporting periods in mind.
CPI by region and genre
| Segment | CPI, Adjust 2025 | Change vs 2024 |
|---|---|---|
| Global, blended | $0.56 | +30% |
| North America | $1.68 | +31%, from $1.28 |
| Europe | $0.53 | +47%, from $0.36 |
| Latin America | $0.14 | +40% |
| Slots | $4.47 | Not stated |
| Idle RPG | $3.19 | Not stated |
| Strategy | $1.03 | Not stated |
CPI by platform and genre
Liftoff's 2025 Casual Gaming Apps Report, covering February 2024 to February 2025, found generally higher iOS CPIs. Casino had the highest iOS CPI at $21.03; RPGs had the highest Android CPI at $4.29. Simulation, action and racing saw roughly 10 times higher CPIs on iOS (GameDev Reports, Liftoff).
Liftoff's older midcore figures remain useful for relative gaps:
| Midcore segment, May 2022–May 2023 | CPI | D7 ROAS |
|---|---|---|
| Average | $2.03 | 4.3% |
| Android / iOS | $0.73 / $3.86 | 6.1% / 3.4% |
| Shooters | $7.47 | 6% |
| Strategy | $2.77 | 5.4% |
| RPG | $0.60 | 1.7% |
| North America / Latin America | $5.45 / $0.27 | 4.5% / 1.5% |
Apple Ads search: US medians
AppTweak's 2026 benchmark report, based on about 2,800 US advertisers and 2025 data, puts games at a median $2.03 cost per tap, $4.63 CPI and 61.8% tap-to-install conversion. Median CPI varied by campaign:
| Campaign type | Median game CPI |
|---|---|
| Brand | $3.73 |
| Generic | $7.84 |
| Competitor | $8.69 |
| Discovery | $1.34 |
These are AppTweak's benchmarks. Brand bidding is cheap, but captures people already looking for you.
Which acquisition channels to use
AppsFlyer's 2025 Performance Index, covering 16.2 billion installs across more than 39,000 apps, ranked Apple Ads first for global iOS gaming. AppLovin narrowed the gap and led in North America and Western Europe. Google Ads led Android gaming, while AppLovin, Mintegral and rewarded platforms such as adjoe made major gains (AppsFlyer).
The practical read: Apple Ads and Google App Campaigns for intent, ad networks for scale, and social video for creative testing.
Measure ROAS before scaling
Return on ad spend (ROAS) is cohort revenue divided by acquisition spend, measured at a specified day. D7 covers the first seven days after install; D30 covers the first thirty. A 47% D30 ROAS means $1 spent has returned $0.47 by day 30.
| Liftoff casual benchmark, 2024 data | iOS D30 ROAS | Android D30 ROAS |
|---|---|---|
| Average | 47% | 15% |
| Sports | 80% | 21% |
| Kids | 68% | 8% |
| Strategy | 60% | 27% |
Android installs are cheaper, but these averages show slower payback. 100% ROAS is break-even on ad spend; lower early ROAS is not automatically bad if players keep paying afterward.
Illustrative maths, not a benchmark: if 90-day revenue per player is $3.00, a $4.63 Apple Ads install loses money, while a $1.34 discovery install clears it. Estimate lifetime value (LTV) in soft launch before setting a CPI ceiling.
Android is cheaper to test, so a common approach is to validate there, then scale on iOS once retention is proven.
How much a mobile game soft launch costs
A soft launch tests retention and monetization in smaller markets before scaling. Public cost data is thin. Game Growth Advisor gives these planning ranges:
| Programme | Total cost | Paid media portion |
|---|---|---|
| Lean: four weeks, one market | $11,000–$23,000 | $9,000–$15,000 |
| Full: twelve weeks, two markets | $62,000–$110,000 | $54,000–$90,000 |
The totals include media and creative; development and a full global launch are separate. Paid media is the largest component. The guide identifies some thresholds as its own operating conventions, so treat these as one practitioner's estimates, not universal prices (Game Growth Advisor).
- Sample size: Its calculation requires 896 installs to measure D1 retention near 30% within three percentage points at 95% confidence. It recommends roughly 1,000 purchased installs per test cell.
- Markets: It advises excluding the US, Japan, South Korea and China from phase one because they are expensive.
- Retention reference: Adjust measured 2025 D1 retention at 27% across genres and 23% for family games.
- Android gate: New personal Google Play developer accounts need at least 12 testers opted into a closed test for 14 days before applying for production access. Plan this before media (Google Play Console Help).
Creative production and testing budgets
Creative is the main CPI lever because it drives click-through and install rates. Public pricing is scarce. AppAgent quotes $5,000–$20,000 or more monthly for creative production, with testing budgets of $500–$1,000 daily per region and platform, rising to $3,000–$5,000 daily when scaling (AppAgent). These are agency-published, not independently audited figures.
Indies can start far smaller: capture real gameplay, cut several short variants around one hook, and commission polished video only for winners.
Mobile game influencer costs
LaunchPoint HQ, updated March 2026, puts TikTok gaming creators with 10,000–500,000 followers at $300–$4,000 per video:
| Format | Quoted price |
|---|---|
| Dedicated gameplay | $300–$800 |
| Skit or POV integration | $800–$2,500 |
| Deep-dive review | $1,500–$4,000 |
Add 30%–50% for 30-day Spark Ads usage rights and up to 50% for rush turnarounds. The page states no methodology, so use these as negotiating references, not a rate card (LaunchPoint HQ).
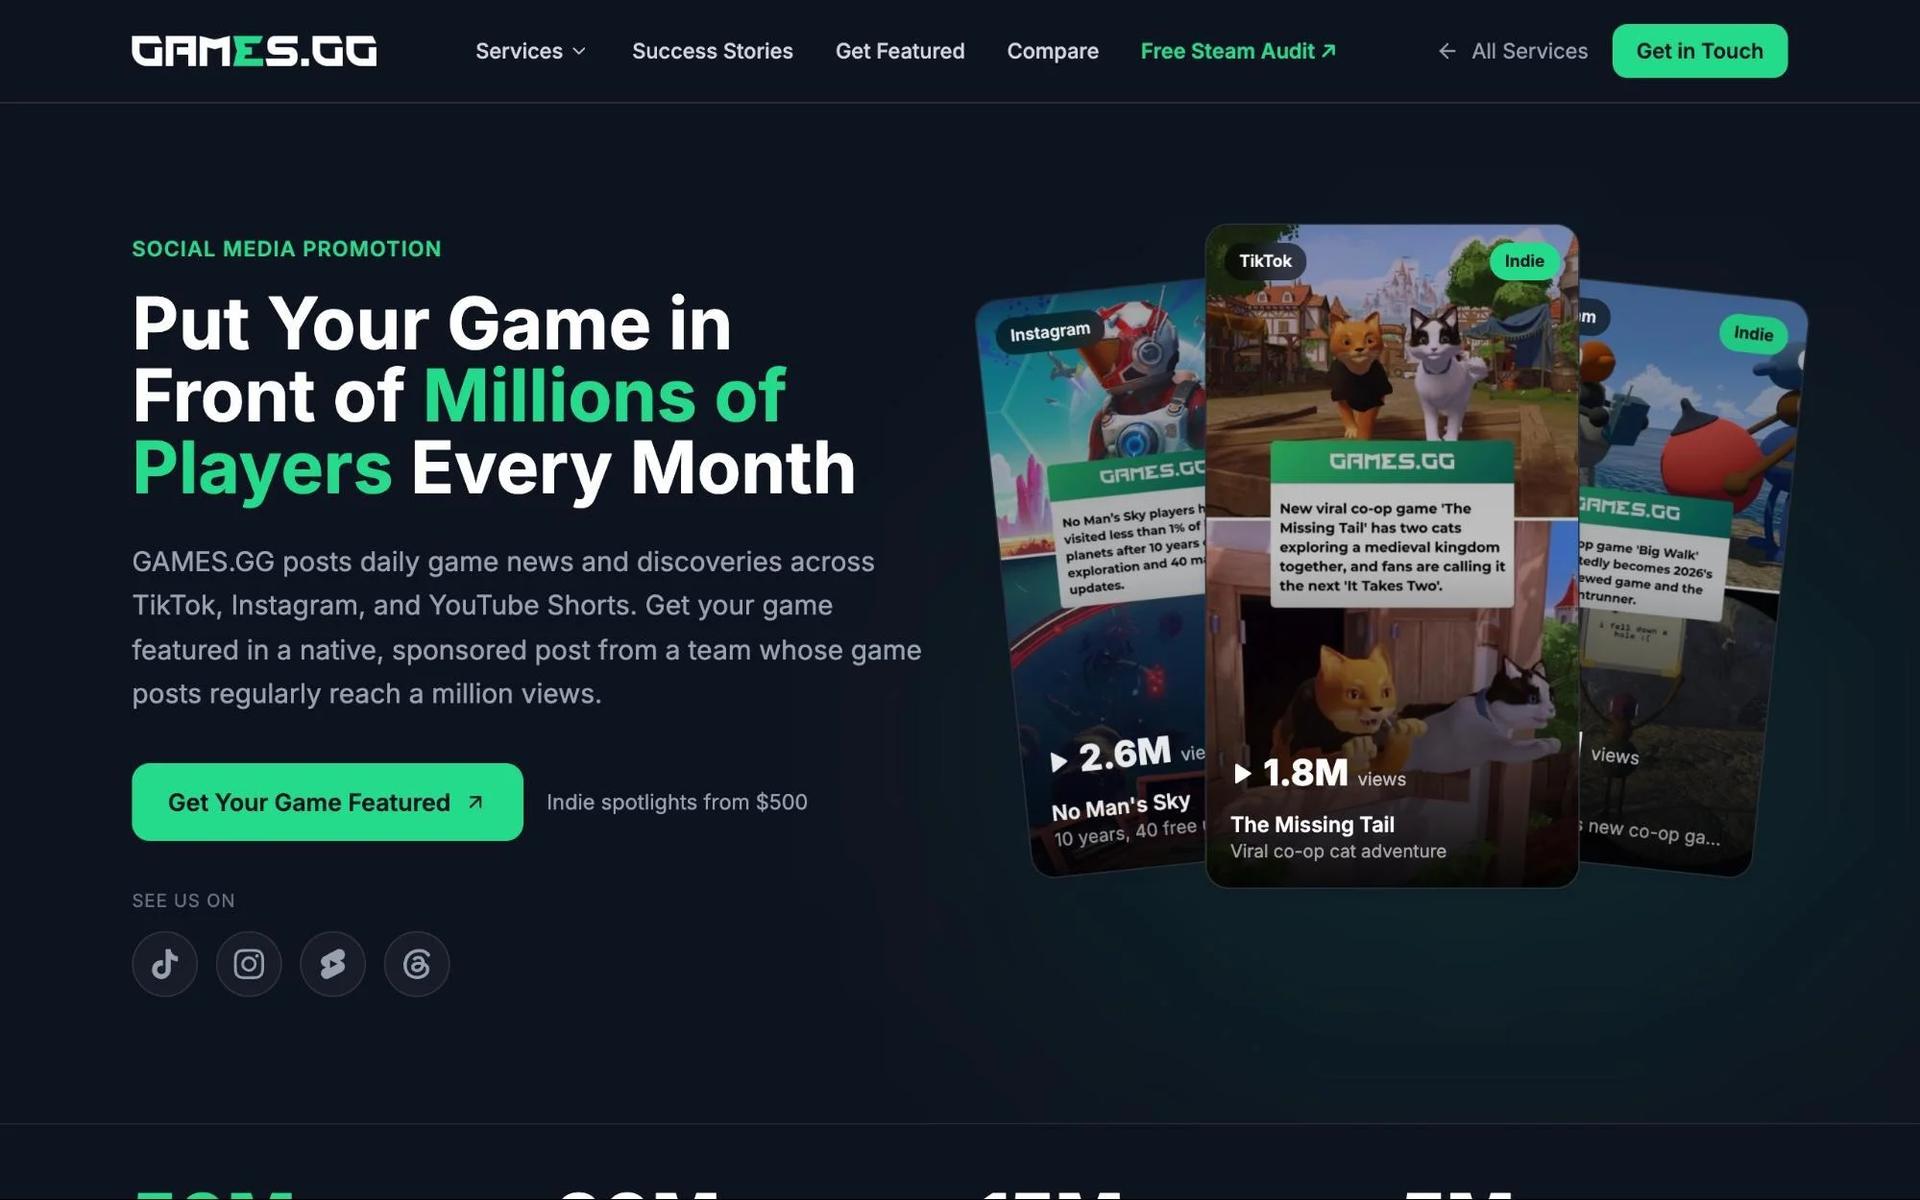
Always give creators tracked links to compare CPI with paid channels. Our influencer marketing comparison and social media features explain how GAMES.GG works with creators and its own social audience.
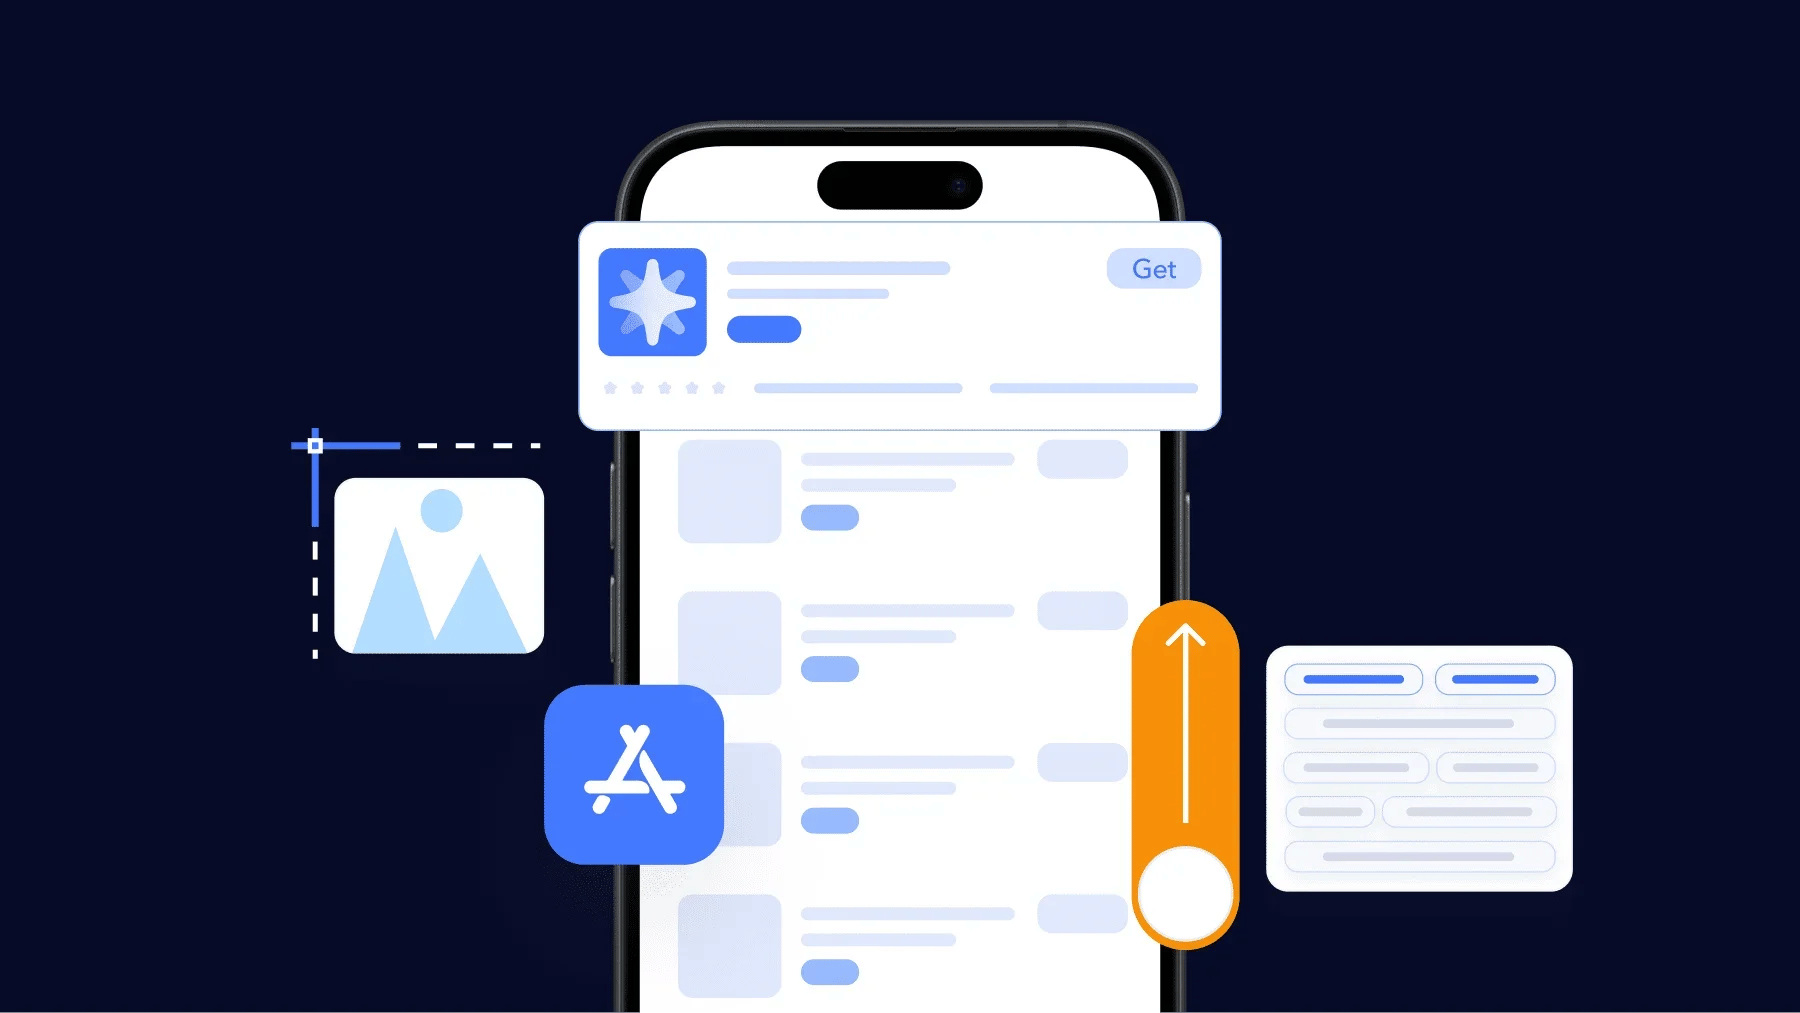
How ASO can lower acquisition costs
Organic installs carry no media cost, making app store optimization (ASO) the cheapest install source you control. Adjust's median paid-to-organic ratio rose from 2.07 to 3.33 in 2025, reaching 3.53 in the US. By our arithmetic, roughly one install in four was organic (Adjust via GameDev Reports).
AppTweak's 2025 US data shows:
- Top-20 Google Play games updated screenshots 12.75 times annually on average, versus 4.44 for games ranked 500–1,000.
- 51% of top Google Play games ran at least two screenshot tests, versus 33% on the App Store.
- 51% of top games ran more than five in-app events, up from 38% in 2023.
- 74% of game advertisers used no Apple custom product pages. Those using them converted taps to installs at 56.8%, versus 54.0% for default pages.
The AppTweak findings highlight screenshots, events and custom pages as practical levers. Apple allows up to 70 additional custom product pages per app, leaving room to match pages to ad angles (Apple).
Whiteout Survival, from Century Games, earned about $918 million in H1 2026 in-app purchases, according to Sensor Tower.

Mobile game marketing agency pricing
AppAgent publishes these ranges:
- Strategic audit: $10,000–$30,000.
- Growth retainer: $8,000–$30,000 or more monthly.
- Minimum media spend: Around $25,000 monthly.
- Percentage model: 10%–20% of ad spend.
These reflect one agency's market view, so get several quotes. Agencies and publishers price differently; our agency comparison covers the options.
Where to spend first
| Priority | What to fund | Reference cost or requirement |
|---|---|---|
| 1 | ASO: screenshots, tests, custom pages | Mostly time |
| 2 | Android closed test | 12 testers, 14 days |
| 3 | Lean soft launch | $11,000–$23,000 |
| 4 | Creative testing | From $5,000 monthly at agency rates |
| 5 | Creators with tracked links | $300–$4,000 per TikTok video |
| 6 | Apple Ads brand and discovery | $3.73 and $1.34 median CPI |
| 7 | Scale paid user acquisition | Only after payback is visible |
Our 2027 prediction: Falling downloads and rising ad spend will keep upward pressure on CPI. Retention and payback will matter more than install volume.
Where GAMES.GG fits
For verified players rather than raw installs, GAMES.GG'splayer acquisition service runs quest-based campaigns across Steam, mobile and console titles. It tracks first-party signals including code activations and hours played, with campaigns starting at $2,000.
The page publishes no per-player price, so request a quote against the CPI benchmarks above.